![]()
Hello All,
I have a problem that happened not only with ELK, but also with
VASP/Phonopy, but as it nonetheless occurs in ELK too, I thought someone
might recognize it and be able to help me with it.
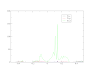
I want to plot the phonon bandstructure of Si. The plot looks exactly
the same as it looked with VASP/Phonopy (See attached picture). It does
not, however correspond to either the actual bandstructure (See the
other picture. Isabel Klett, Tobias Zier, Baerbel Rethfeld, Martin E.
Garcia, and Eeuwe S. Zijlstra. Isostructural elemental crystals in the
presence of hot carriers. Phys.Rev. B, 91:144303, 2015).
The traversed path is (Gamma, X, L, W, K, Gamma).
Symmetries which should not exist can clearly be seen at 0.5, 2.5 and
3.625, but otherwise, the plot shows striking similarities to the true
bandstructure. I just can't seem to find any errors.
The elk.in file used was:
tasks
0
205
220
nrmtscf
4
! You can add notes to the INFO.OUT file using the "notes" block
notes
avec
5.13 5.13 0.00
5.13 0.00 5.13
0.00 5.13 5.13
! this is the relative path to the species files
sppath
'<species_folder>'</species_folder>
atoms
1 : nspecies
'Si.in' : spfname
2 : natoms; atposl below
0.0 0.0 0.0
0.25 0.25 0.25
ngridk
4 4 4
ngridq
4 4 4
plot1d
6 200
0.0 0.0 0.0
0.0 1.0 0.0
0.5 0.5 0.5
0.5 1.0 0.0
0.75 0.75 0.0
0.0 0.0 0.0
Can anyone help me with this problem?
Thanks in advance.
Last edit: Thilo Waldmann 2019-07-09
-

-

Dear Thilo,
You use the wrong k-path. Remember that the k-points under plot1d is given in reciprocal lattice vectors. So you go from Gamma (0,0,0) to another Gamma (0,1,0) centered in next BZ. The reciprocal lattice vectors are given in INFO.OUT and you have to express X as a linear combination of them ...
Good luck,
Lars
![]()
Thank You!
https://sourceforge.net/p/elk/discussion/897820/thread/217fd7d24f/


0 Comments