![]()
Dear all,
I would ask some information on the Hubbard correction in elk. I'm
studying the cerium dioxide, that in the literature is simulated with an
Hubbard correction in the range 5-7 eV. While in the literature there
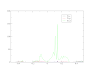
is essentially a rigid shift of the 4f states (the main peak in the
attached figure), in Elk the Hubbard correction produces a split, with a
small peak at lower energy for U=6-7 eV. Somewhere in the discussions I
read that the Hubbard correction effect can be different in Elk, is it
true? It seems that some cerium 4f states are not influenced by the
correction...
tasks
   0

! DFT+U block
! here FLL double counting is used (dftu=1)
! inpdftu=1 corresponds to provide U and J in Hartree as input
dft+u
  1 1                             : dftu,inpdftu
  1 3 0.220495829 0.0             : is, l, U, J

xctype
  3

highq
 .true.

nempty
  100

swidth
  0.01

spinpol
  .false.

scale
  5.098375554

avec
  1.0  1.0  0.0
  1.0  0.0  1.0
  0.0  1.0  1.0

atoms
  2                                    : nspecies
  'Ce.in'                              : spfname
  1                                    : natoms; atpos, bfcmt below
  0.0   0.0   0.0    0.0  0.0  0.0
  'O.in'                               : spfname
  2                                    : natoms; atpos, bfcmt below
  0.25  0.25  0.25   0.0  0.0  0.0
  0.75  0.75  0.75   0.0  0.0  0.0

sppath
  '../../../species/'

autokpt
 .false.

ngridk
10 10 10
-

Dear Andrea,
first in CeO2 we have the case of an f0 element, means no electrons in the f-states. Thus the U-correction will shift the empty levels upwards, which is also the case from your DOS. What would be interesting to see would be to have a look at the f-states only (partial dos) to see what are really f-states in your plot but I would assume its the double peak. Is this correct?
Regarding the effect of U it should make no difference to other codes. The only technical swtich you can do is to go from FullLocalizedLimit to the MeanField implementation, which only changes how the U affects the states. Could You give a reference to literature what is different from your results with elk?
best
Michael
-

Thank you Michael, sorry for the delay, here for example in fig. 2 the 2p-4f gap is an increasing function of the Hubbard correction. In general, I did not found any mention to the second small peak that I found.
http://citeseerx.ist.psu.edu/viewdoc/download?doi=10.1.1.451.9410&rep=rep1&type=pdf
I tried to plot the partial density on the Cerium, but is not clear to me how to assign the states to the different lines, I get 16 partial dos for Cerium, with the following relation between the columns
1
2=3=4
5=6=7
8=9
10
11=12=13
14=15=16
The main peak are related to the columns 11-16 while the small unshifted peak is the column 10.
Could you help me in assign the columns to the states?Thanks again,
Andrea
![]()
Sorry, I posted as Anonymous...
https://sourceforge.net/p/elk/discussion/897820/thread/4f7e875e89/


0 Comments